Overview
This in-dashboard tool allows you to identify queries that are running too often, too long, returning too much data, producing errors, and more. You can scroll through the performance graph to detect the time of impacted performance, quickly identifying any recent issues. You can also see a list of all queries performed on your database in the last 24 hours. For further analysis, you can sort these by metrics like amount of rows read, time per query, and more. With this built-in tool, you can easily diagnose issues with your queries, allowing you to optimize individual queries without much digging. We will also alert you of any active issues your database may be having in the Anomalies page. This feature flags queries that are running significantly slower than expected.Insights page overview
To view Insights for your database, head to the PlanetScale dashboard, select your database, and click the “Insights” tab. The dropdown on the top left lets you select which branch you want to analyze. You can also choose which servers you want to view insights for: primary or replicas.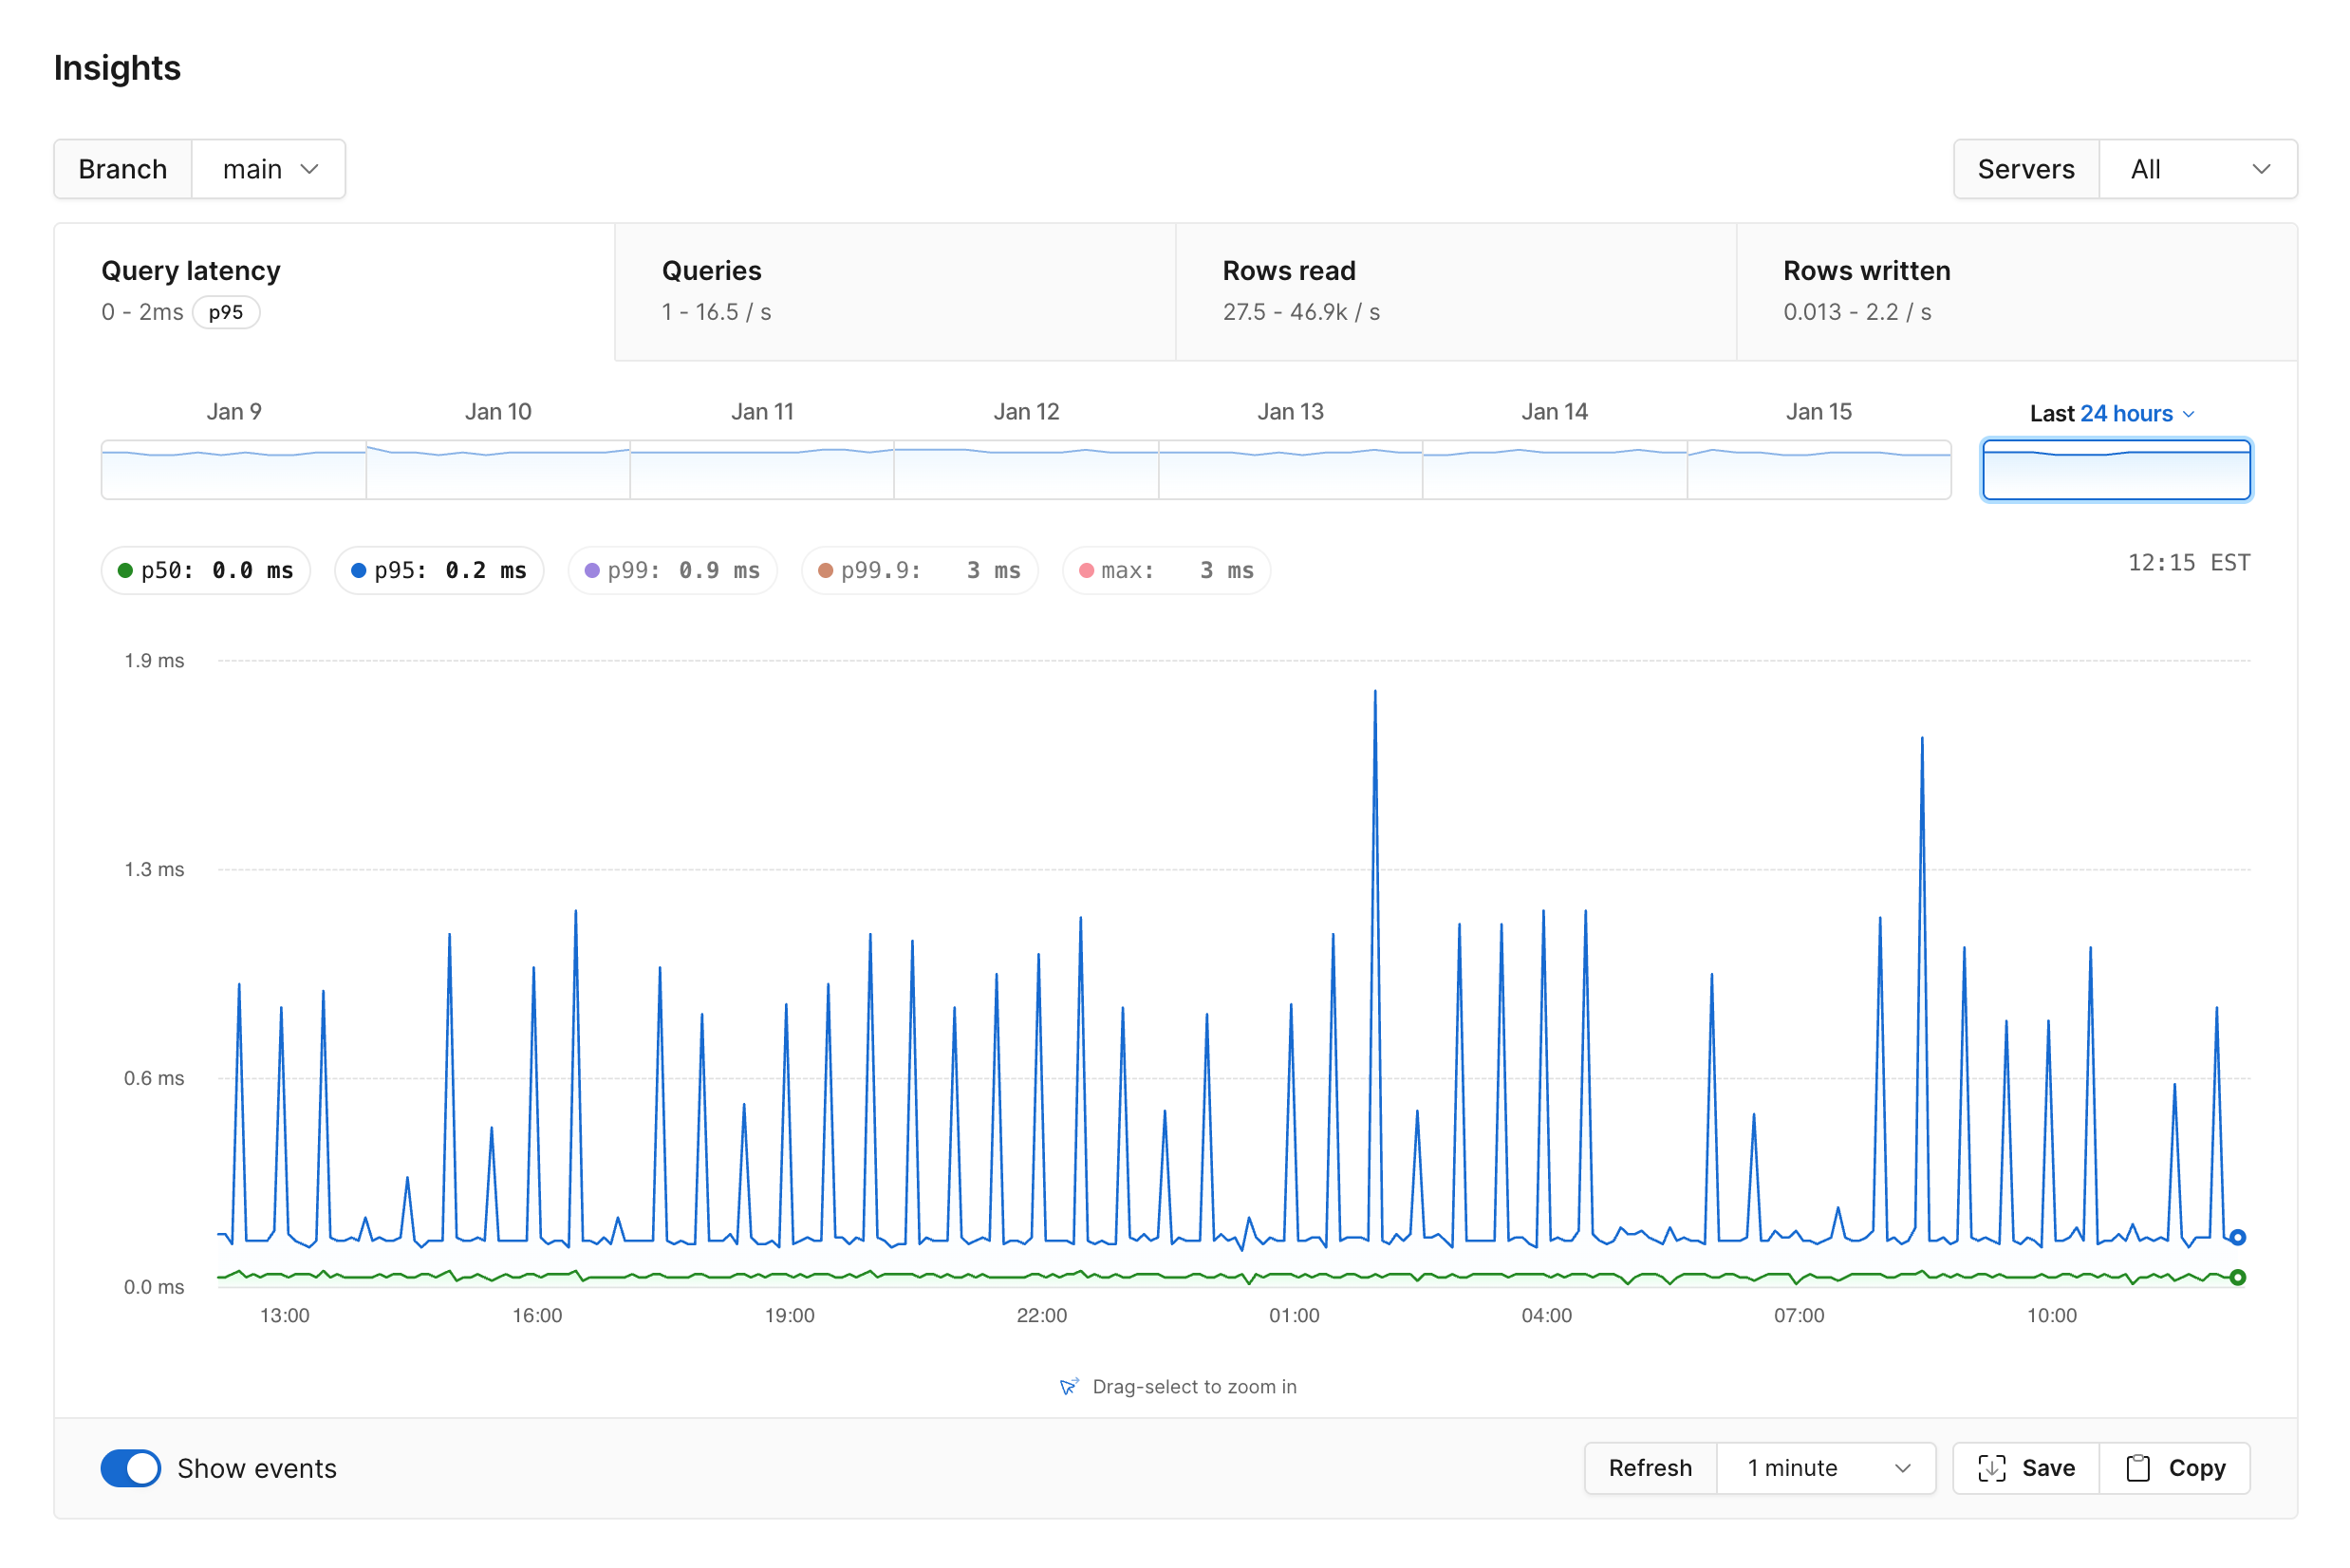
Queries overview table
The table underneath the graph shows all queries performed on your database in the selected timeframe (last 24 hours by default). For more information about how to read and interpret this data, see the Queries overview section.Insights graphs
Once you have selected the branch and server you want to analyze, you can begin exploring the insights for them in the following sections: The remaining sections of this doc walk through how to interpret and act on the data in each graph. If you’d like to see a practical example of how to use Insights to debug a performance issue, check out our Announcing Insights blog post or this YouTube video walking you through an example.Query latency
The default graph depicts your database’s query latency in milliseconds over the last 24 hours. By default, the graph contains two line charts showingp50 and p95 latency. This means 50% and 95% of requests, respectively, completed faster than the time listed. You can also click on the p99 and p99.9 pills to toggle those on, or click p50 or p95 to toggle those off.
Queries
The Queries graph displays insights about all active running queries in your database. The graph displays total queries per second against the specified time period.Rows read
The Rows read graph displays the total number of rows read per second across the selected time period.Rows written
The Rows written graph displays the total number of rows written per second across the selected time period.Queries overview
The table underneath the graph shows queries performed on your database in the selected timeframe (last 24 hours by default).The queries table does not show following statements types:
BEGIN, COMMIT, RELEASE, ROLLBACK, SAVEPOINT, SAVEPOINT_ROLLBACK, SET.$1). Normalizing queries in this way allows them to be grouped together into patterns, irrespective of the specific parameters used in the underlying query.
You may also see one or more orange icons next to some queries.
- An exclamation point icon indicates that the query is not currently using an index and requires a full table scan.
Available query statistics
You can customize the metrics that show up on the Queries list by selecting columns in the “View options” dropdown.- Query - The query that was run.
- Schema - The default database and schema associated with the connection that issued the query, in the format
database.schema. - Qualified table — The table(s) referenced in the query, in the format
database.schema.table_name. - Table schema — The schema(s) associated with the tables referenced in the query, in the format
database.schema. (This may differ from the connection schema.) - Table — The table(s) being queried or modified.
- % of runtime — The percent of the total runtime the query pattern is responsible for (query pattern time divided by the cumulative time of all query patterns on your database).
- % of CPU — The percent of the total CPU time the query pattern is responsible for (query pattern CPU time divided by the cumulative CPU time of all query patterns on your database).
- % of I/O — The percent of the total I/O time the query pattern is responsible for (query pattern IO time divided by the cumulative IO time of all query patterns on your database). This column is only present if
track_io_timingparameter is set in your database’s cluster configuration. - Count — The number of times this query has run.
- Total time (s) — The total time the query has run in seconds.
- CPU time (s) — The cumulative CPU time the query has consumed in seconds.
- I/O time (s) — The cumulative I/O time the query has consumed in seconds. This column is only present if
track_io_timingparameter is set in your database’s cluster configuration. p50latency — Thep50latency for the query in milliseconds. This means that 50% of requests completed faster than the time listed.p99latency — Thep99latency for the query in milliseconds. This means that 99% of requests completed faster than the time listed.- Max latency — The maximum observed latency for the query in milliseconds.
- Rows returned — The total number of rows fetched by a
SELECTstatement. This includes all times the query has run in the displayed time frame. - Rows read — The total number of rows read. This includes all times the query has run in the displayed time frame.
- Rows read/rows returned — The result of dividing total rows read by rows returned in a query. A high number can indicate that your database is reading unnecessary rows, and the query may be improved by adding an index.
- Rows affected — The total number of rows modified by an
INSERT,UPDATE, orDELETEstatement. This includes all times the query has run in the displayed time frame. - Block cache hit ratio – The percentage of blocks read from the shared buffers cache for this query during its execution, avoiding more costly disk reads.
- Blocks hit – The total number of blocks read from the shared buffers cache when executing this query.
- Blocks read – The total number of blocks read from disk when executing this query.
- Blocks dirtied – The total number of blocks modified (but not necessarily flushed to disk) during query execution.
- Blocks written – The total number of blocks written to disk during query execution.
- Bytes returned – The total number of bytes returned to clients in query responses.
- Bytes returned per query — The total number of bytes returned to clients in query responses divided by the number of queries.
- Last run — The last time a query was run.
Show sparklines is selected, numeric columns in the queries table show a time series graph of the value within the selected time period.
Enabling I/O columns
The % of I/O and I/O time columns require thetrack_io_timing PostgreSQL config setting to be set to ‘on’. This setting can be changed in the “Parameters” tab of the datatbase’s cluster configuration. Note that we only begin collection I/O query performance after track_io_timing is enabled. Enabling track_io_timing may impact query performance.
Query filtering
The search bar above the table allows you to filter queries as needed. You can filter for query SQL, schema (connection schema, and/or schema of tables referenced by the query), table name, query count, query latency, index name, and if the query was indexed. Click on the? next to the search bar for the full list of search syntax.
Query deep dive
Clicking on a query in the Queries list will open a new page with more information about that query. You’ll first see the full query pattern, which displays the query with data normalized away. This query may run several times with different values, which Insights combines into a single query pattern. You can display an LLM-generated summary of the query by clicking “Summarize query.”Additional query information
Beneath the query pattern is a graph with more information about the query. The set of available metrics/tabs include: Query latency, Queries, Rows read, Rows written, Errors and Indexes. The Indexes graph (which is not shown on the database-level page) shows the percentage of queries that used each of the listed indexes in each time bucket. Beneath the time series graphs you will see summary statistics for the query pattern. These data are scoped to the same time period shown in the main query pattern graphs. The available metrics have the same definitions as the query statistics listed in the main insights page. Queries that use an index include a horizontal bar graph that shows the cumulative usage of each index over the complete time period shown in the main query pattern graphs. To change the time period reflected in the graphs and summary statistics, click and drag to restrict the time window, or click on one of the day icons above the graph to select a different day.Notable queries
Underneath the graph, you’ll see a table with more information about notable instances of the query, which are defined as queries that took longer than 1s, read more than 10,000 rows, or produced an error. If any of the selected queries have SQL comment tags attached, you’ll see the key-value pairs in the table underTags.
The table also surfaces when the query started, rows returned, rows read, rows affected, the time it took the query to run (in ms), and the user associated with the query.
Extension configuration
This section describes the configuration parameters available for thepginsights extension, which is responsible for sending query telemetry to the PlanetScale Insights pipeline. These settings can be changed in the Extensions tab on your database’s Clusters page.
Raw query collection
- Setting:
pginsights.raw_queries - Default:
false(disabled)
Enabling this setting may result in sensitive data that appears in queries being sent to PlanetScale, where it will be processed and stored in accordance with our privacy policy.
Schema name normalization
- Setting:
pginsights.normalize_schema_names - Default:
false(disabled)
select * from myschema.users where id = 1.
- With
pginsights.normalize_schema_namesset to false, the query will be reported in insights asselect * from myschema.users where id = $1 - With
pginsights.normalize_schema_namesset to true, the query will be reported in insights asselect * from $1.users where id = $2
pginsights.raw_queries setting so that the full query text (including namespaces) is reported along with slow queries.